What SharePoint Analytics Means in Practice
"SharePoint analytics" covers two different questions that often get conflated. One is engagement: who is visiting a site, which pages get read, what people search for. The other is consumption: how much storage each site holds, what is filling it, and how fast it is growing.
Microsoft reports reasonably well on the first and thinly on the second. Since the second is what drives the storage bill, that is where most administrators run out of native tooling.
What SharePoint Reports Natively
Three native surfaces cover most of what is available without a third-party tool.
The SharePoint admin center, Active sites. A sortable list of every site with its storage used, storage limit, last activity date and template. This is the fastest way to find the largest sites in a tenant, and the right first stop when the pool is filling.
Per-site Storage Metrics. Inside a site, Site settings gives a Storage Metrics page showing what is consuming space within that site, drillable by folder and library. It is genuinely detailed, and it is per site. Auditing fifty sites means opening it fifty times.
Microsoft 365 admin center usage reports. Reports, then Usage, then SharePoint gives site-level file counts and storage trended over a rolling window, with 7, 30, 90 and 180 day views, plus per-site activity.
Where the Native Reporting Stops
Four gaps come up repeatedly.
No tenant-wide file type breakdown. You can see that a site holds 400 GB. Finding out that 240 GB of it is video, or old design files, or ZIP archives nobody has opened in four years, means going site by site.
History caps at 180 days. Usage reports do not retain a longer trend, so year-on-year growth has to be captured manually before the window rolls forward.
No view of what is inactive. Native reporting shows what exists and what is being visited. It does not separate content in daily use from content untouched since 2019, and that distinction is what determines what can safely be archived.
Nothing on archive or restore activity. Once content is archived, native reporting has no concept of it, so there is no native way to measure what archiving has actually saved.
What Is Worth Tracking
For storage management specifically, five measures answer most questions:
- Storage by site, sorted descending, to find where the growth is
- Storage by file type, to identify content that does not belong in SharePoint at all
- Largest individual files, since a handful of large objects often account for a surprising share of a site
- Age of last modification, which is the practical proxy for whether content is still working
- Growth rate per site, because a small site growing quickly matters more than a large static one
Getting the Breakdown SharePoint Does Not Give You
SharePoint Storage Explorer, for the free audit
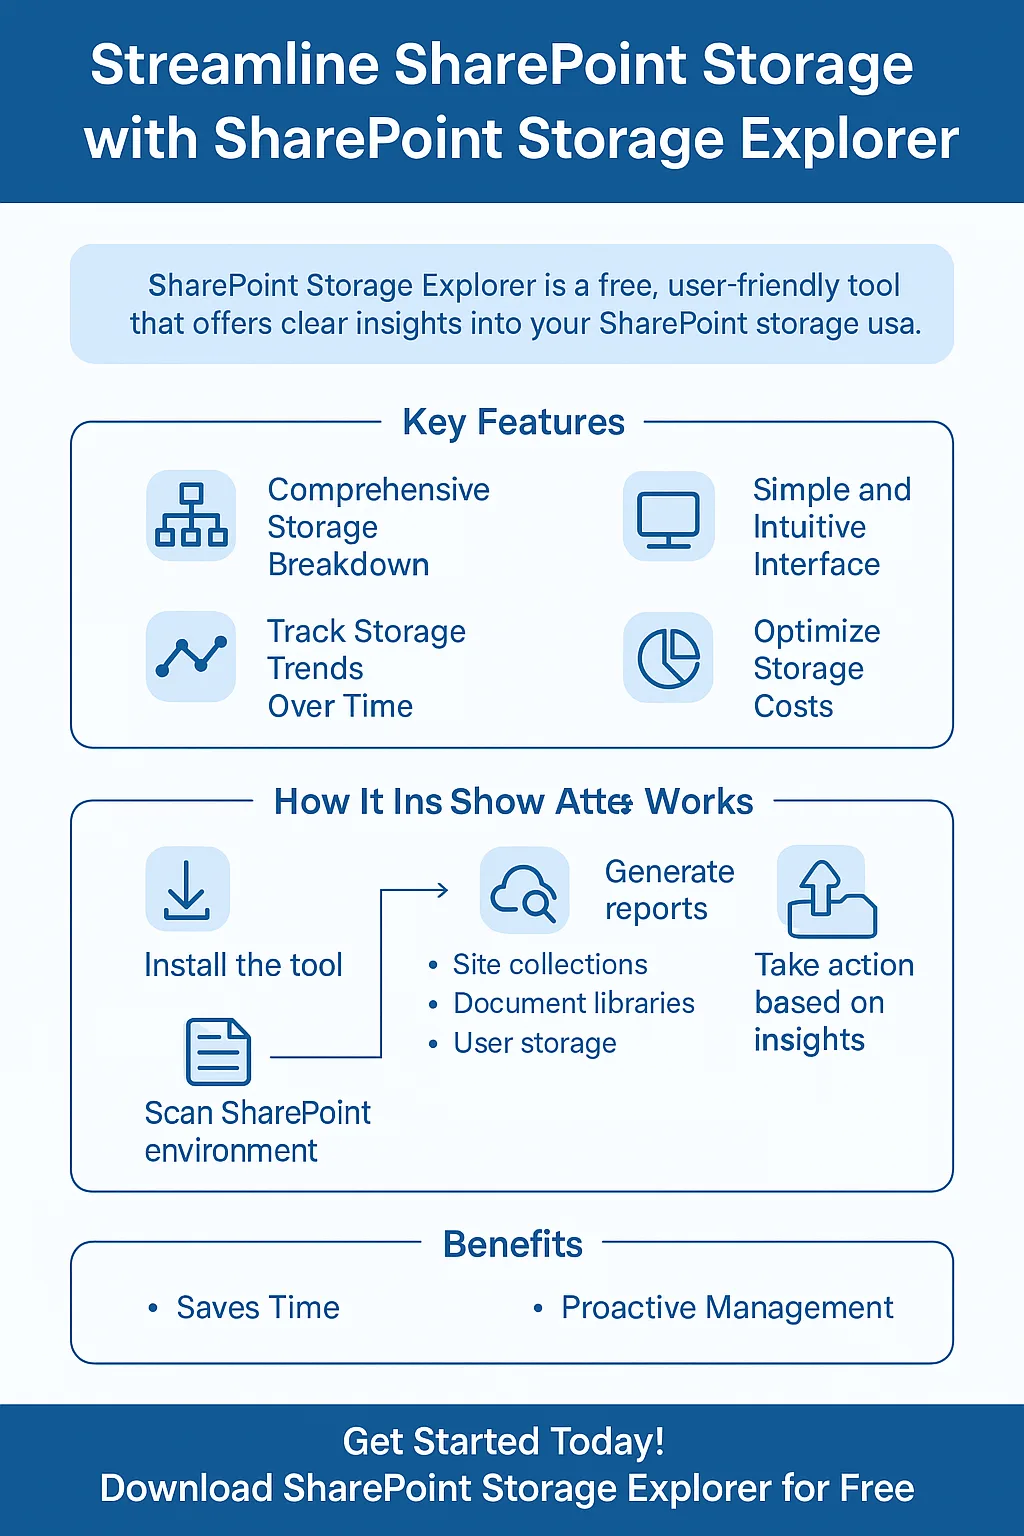
SharePoint Storage Explorer is a free Windows tool that scans a tenant and reports storage by site collection, document library and file type in one pass, rather than one site at a time. It surfaces the largest files and folders, which is usually where the quickest reduction is found, and it is the practical way to build a picture of a tenant before deciding what to do about it.
It answers the audit question. It does not manage the content afterwards.
Squirrel, for ongoing platform reporting
Where Storage Explorer gives a point-in-time audit, the Squirrel platform reports continuously on archive and restore activity across the tenant. Reports are generated on demand and export to CSV, and they fall into three groups.
File reports cover files archived and restored today, this month and this year, files archived by extension, storage by file type, and a Large Files report identifying the 100 largest files over 100 MB.
Storage reports give the same today, month and year windows measured in gigabytes archived and restored, rather than in file counts.
Site data reports break archive and restore volume down per SharePoint site across rolling 30, 90, 180 and 365 day windows, which is the view that shows where a policy is working and where it is not.
The dashboard sits alongside these with total archived data, archive and restore transaction counts, the percentage of the estate archived, and total storage savings. There are also read-only analytics pages covering site activity and recent history.
The distinction worth drawing is that this is reporting on a live archiving programme rather than a one-off audit. It answers what has moved, from which sites, and what it saved, which is the question that follows once archiving is actually running.
Frequently Asked Questions
Does SharePoint have built-in analytics?
Yes, in two places. Site-level usage reports cover visits, unique viewers and popular content. The SharePoint admin center covers storage per site, and the Microsoft 365 admin center adds usage trends over 7 to 180 days. What is missing is a tenant-wide breakdown by file type, and any view of which content is inactive.
How do I see which SharePoint sites use the most storage?
Open Active sites in the SharePoint admin center and sort by storage used. That gives the ranking immediately. To see what is inside those sites, either open Storage Metrics on each one individually, or scan the tenant with a tool that reports across all sites in one pass.
Can I see SharePoint storage by file type?
Not natively across a tenant. Per-site Storage Metrics shows what is consuming space within a single site, but there is no built-in report that aggregates file types tenant-wide. That breakdown needs a third-party scan.
How long does SharePoint keep usage data?
Microsoft 365 usage reports offer 7, 30, 90 and 180 day views. Longer trends have to be captured before the window rolls forward, which is why organisations tracking year-on-year growth usually export periodically.
What is the difference between SharePoint analytics and storage reporting?
Analytics in the Microsoft sense usually means engagement: who visited, what was read, what was searched. Storage reporting means consumption: how much space is used, by what, and growing how fast. Both get called analytics, and the second is the one that drives cost.
Related reading
- SharePoint Storage Explorer - the free tool for auditing storage by site, library and file type
- How to check SharePoint storage size - the three native routes and what each shows
- Find the largest SharePoint sites - narrowing down where the growth actually is
- How to reduce SharePoint Online storage - what to do once you know what is filling it
- SharePoint Online pricing and licensing - what the storage costs per GB above the pool
See Where Your Storage Is Going
Storage reporting is only useful if it changes a decision. If the audit shows a large share of your tenant is content nobody has touched in years, Squirrel archives it to your own Azure Blob Storage and leaves a stub in place, so the site stays live and the reporting keeps tracking what moved. Questions: sales@smikar.com.
Mark Smith co-founded SmiKar Software in 2015 and has spent the past decade helping organisations solve Microsoft 365 data management challenges. He works with the SmiKar team to build solutions for SharePoint archiving, storage optimisation, governance and compliance, supporting customers from growing businesses through to Fortune 500 enterprises.
More about SmiKar